
Page 46 - Demo
P. 46
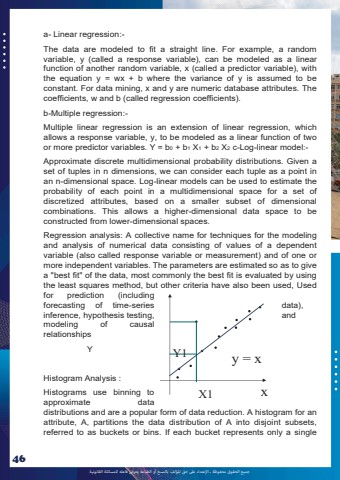
%u062c%u0645%u064a%u0639 %u0627%u0644%u062d%u0642%u0648%u0642 %u0645%u062d%u0641%u0648%u0638%u0629 %u0640 %u0627%u0625%u0644%u0639%u062a%u062f%u0627%u0621 %u0639%u0649%u0644 %u062d%u0642 %u0627%u0645%u0644%u0624%u0644%u0641 %u0628%u0627%u0644%u0646%u0633%u062e %u0623%u0648 %u0627%u0644%u0637%u0628%u0627%u0639%u0629 %u064a%u0639%u0631%u0636 %u0641%u0627%u0639%u0644%u0647 %u0644%u0644%u0645%u0633%u0627%u0626%u0644%u0629 %u0627%u0644%u0642%u0627%u0646%u0648%u0646%u064a%u062946a- Linear regression:-The data are modeled to fit a straight line. For example, a random variable, y (called a response variable), can be modeled as a linear function of another random variable, x (called a predictor variable), with the equation y = wx + b where the variance of y is assumed to be constant. For data mining, x and y are numeric database attributes. The coefficients, w and b (called regression coefficients). b-Multiple regression:-Multiple linear regression is an extension of linear regression, which allows a response variable, y, to be modeled as a linear function of two or more predictor variables. Y = b0 + b1 X1 + b2 X2 c-Log-linear model:-Approximate discrete multidimensional probability distributions. Given a set of tuples in n dimensions, we can consider each tuple as a point in an n-dimensional space. Log-linear models can be used to estimate the probability of each point in a multidimensional space for a set of discretized attributes, based on a smaller subset of dimensional combinations. This allows a higher-dimensional data space to be constructed from lower-dimensional spaces. Regression analysis: A collective name for techniques for the modeling and analysis of numerical data consisting of values of a dependent variable (also called response variable or measurement) and of one or more independent variables. The parameters are estimated so as to give a \the least squares method, but other criteria have also been used, Used for prediction (including forecasting of time-series data), inference, hypothesis testing, and modeling of causal relationships Y Histogram Analysis : Histograms use binning to approximate data distributions and are a popular form of data reduction. A histogram for an attribute, A, partitions the data distribution of A into disjoint subsets, referred to as buckets or bins. If each bucket represents only a single xy = x X1Y1
