


Page 53 - Demo
P. 53
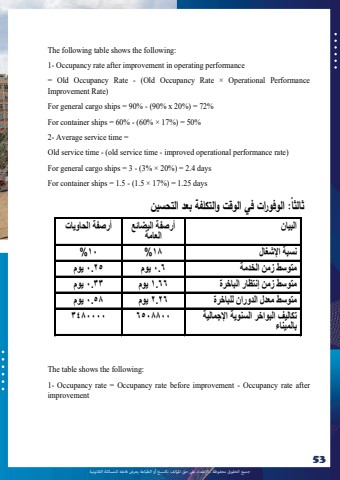
%u062c%u0645%u064a%u0639 %u0627%u0644%u062d%u0642%u0648%u0642 %u0645%u062d%u0641%u0648%u0638%u0629 %u0640 %u0627%u0625%u0644%u0639%u062a%u062f%u0627%u0621 %u0639%u0649%u0644 %u062d%u0642 %u0627%u0645%u0644%u0624%u0644%u0641 %u0628%u0627%u0644%u0646%u0633%u062e %u0623%u0648 %u0627%u0644%u0637%u0628%u0627%u0639%u0629 %u064a%u0639%u0631%u0636 %u0641%u0627%u0639%u0644%u0647 %u0644%u0644%u0645%u0633%u0627%u0626%u0644%u0629 %u0627%u0644%u0642%u0627%u0646%u0648%u0646%u064a%u062953- 53 -The following table shows the following:1- Occupancy rate after improvement in operating performance= Old Occupancy Rate - (Old Occupancy Rate %u00d7 Operational Performance Improvement Rate)For general cargo ships = 90% - (90% x 20%) = 72%For container ships = 60% - (60% %u00d7 17%) = 50%2- Average service time =Old service time - (old service time - improved operational performance rate)For general cargo ships = 3 - (3% %u00d7 20%) = 2.4 daysFor container ships = 1.5 - (1.5 %u00d7 17%) = 1.25 daysThe table shows the following:1- Occupancy rate = Occupancy rate before improvement - Occupancy rate after improvement : % %


