
Page 112 - Demo
P. 112
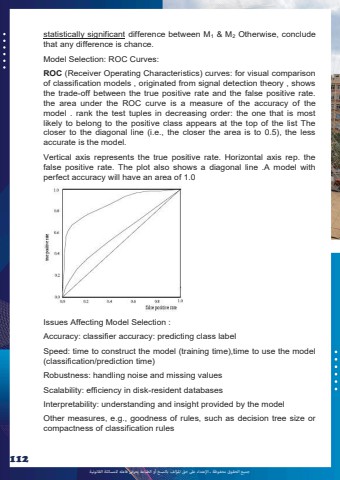
%u062c%u0645%u064a%u0639 %u0627%u0644%u062d%u0642%u0648%u0642 %u0645%u062d%u0641%u0648%u0638%u0629 %u0640 %u0627%u0625%u0644%u0639%u062a%u062f%u0627%u0621 %u0639%u0649%u0644 %u062d%u0642 %u0627%u0645%u0644%u0624%u0644%u0641 %u0628%u0627%u0644%u0646%u0633%u062e %u0623%u0648 %u0627%u0644%u0637%u0628%u0627%u0639%u0629 %u064a%u0639%u0631%u0636 %u0641%u0627%u0639%u0644%u0647 %u0644%u0644%u0645%u0633%u0627%u0626%u0644%u0629 %u0627%u0644%u0642%u0627%u0646%u0648%u0646%u064a%u0629112statistically significant difference between M1 & M2 Otherwise, conclude that any difference is chance. Model Selection: ROC Curves: ROC (Receiver Operating Characteristics) curves: for visual comparison of classification models , originated from signal detection theory , shows the trade-off between the true positive rate and the false positive rate. the area under the ROC curve is a measure of the accuracy of the model . rank the test tuples in decreasing order: the one that is most likely to belong to the positive class appears at the top of the list The closer to the diagonal line (i.e., the closer the area is to 0.5), the less accurate is the model. Vertical axis represents the true positive rate. Horizontal axis rep. the false positive rate. The plot also shows a diagonal line .A model with perfect accuracy will have an area of 1.0 Issues Affecting Model Selection : Accuracy: classifier accuracy: predicting class label Speed: time to construct the model (training time),time to use the model (classification/prediction time) Robustness: handling noise and missing values Scalability: efficiency in disk-resident databases Interpretability: understanding and insight provided by the model Other measures, e.g., goodness of rules, such as decision tree size or compactness of classification rules
