
Page 22 - Demo
P. 22
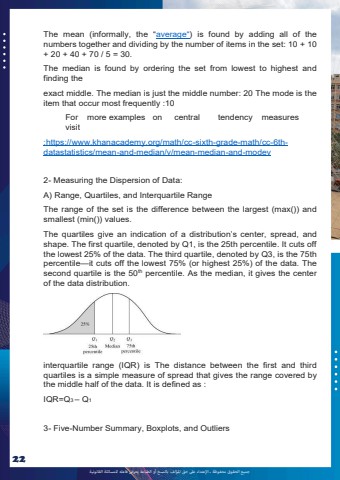
%u062c%u0645%u064a%u0639 %u0627%u0644%u062d%u0642%u0648%u0642 %u0645%u062d%u0641%u0648%u0638%u0629 %u0640 %u0627%u0625%u0644%u0639%u062a%u062f%u0627%u0621 %u0639%u0649%u0644 %u062d%u0642 %u0627%u0645%u0644%u0624%u0644%u0641 %u0628%u0627%u0644%u0646%u0633%u062e %u0623%u0648 %u0627%u0644%u0637%u0628%u0627%u0639%u0629 %u064a%u0639%u0631%u0636 %u0641%u0627%u0639%u0644%u0647 %u0644%u0644%u0645%u0633%u0627%u0626%u0644%u0629 %u0627%u0644%u0642%u0627%u0646%u0648%u0646%u064a%u062922The mean (informally, the %u201caverage%u201c) is found by adding all of the numbers together and dividing by the number of items in the set: 10 + 10 + 20 + 40 + 70 / 5 = 30. The median is found by ordering the set from lowest to highest and finding the exact middle. The median is just the middle number: 20 The mode is the item that occur most frequently :10 For more examples on central tendency measures visit :https://www.khanacademy.org/math/cc-sixth-grade-math/cc-6thdatastatistics/mean-and-median/v/mean-median-and-modev 2- Measuring the Dispersion of Data: A) Range, Quartiles, and Interquartile Range The range of the set is the difference between the largest (max()) and smallest (min()) values. The quartiles give an indication of a distribution%u2019s center, spread, and shape. The first quartile, denoted by Q1, is the 25th percentile. It cuts off the lowest 25% of the data. The third quartile, denoted by Q3, is the 75th percentile%u2014it cuts off the lowest 75% (or highest 25%) of the data. The second quartile is the 50th percentile. As the median, it gives the center of the data distribution. interquartile range (IQR) is The distance between the first and third quartiles is a simple measure of spread that gives the range covered by the middle half of the data. It is defined as : IQR=Q3 %u2013 Q13- Five-Number Summary, Boxplots, and Outliers
