
Page 26 - Demo
P. 26
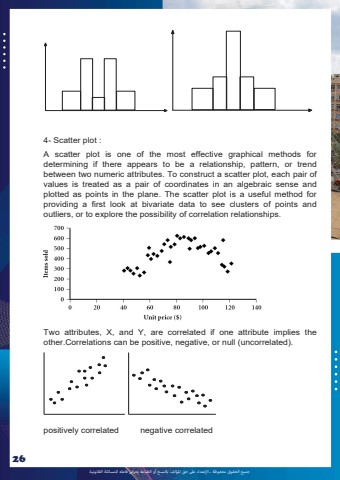
%u062c%u0645%u064a%u0639 %u0627%u0644%u062d%u0642%u0648%u0642 %u0645%u062d%u0641%u0648%u0638%u0629 %u0640 %u0627%u0625%u0644%u0639%u062a%u062f%u0627%u0621 %u0639%u0649%u0644 %u062d%u0642 %u0627%u0645%u0644%u0624%u0644%u0641 %u0628%u0627%u0644%u0646%u0633%u062e %u0623%u0648 %u0627%u0644%u0637%u0628%u0627%u0639%u0629 %u064a%u0639%u0631%u0636 %u0641%u0627%u0639%u0644%u0647 %u0644%u0644%u0645%u0633%u0627%u0626%u0644%u0629 %u0627%u0644%u0642%u0627%u0646%u0648%u0646%u064a%u0629264- Scatter plot : A scatter plot is one of the most effective graphical methods for determining if there appears to be a relationship, pattern, or trend between two numeric attributes. To construct a scatter plot, each pair of values is treated as a pair of coordinates in an algebraic sense and plotted as points in the plane. The scatter plot is a useful method for providing a first look at bivariate data to see clusters of points and outliers, or to explore the possibility of correlation relationships. Two attributes, X, and Y, are correlated if one attribute implies the other.Correlations can be positive, negative, or null (uncorrelated). positively correlated negative correlated
