
Page 24 - Demo
P. 24
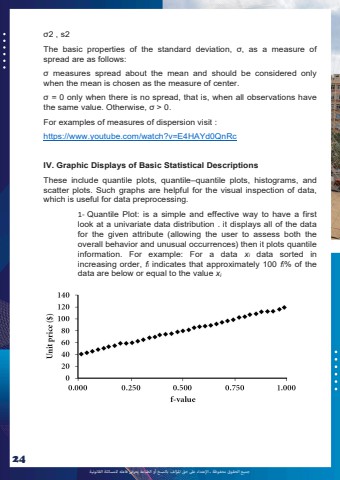
%u062c%u0645%u064a%u0639 %u0627%u0644%u062d%u0642%u0648%u0642 %u0645%u062d%u0641%u0648%u0638%u0629 %u0640 %u0627%u0625%u0644%u0639%u062a%u062f%u0627%u0621 %u0639%u0649%u0644 %u062d%u0642 %u0627%u0645%u0644%u0624%u0644%u0641 %u0628%u0627%u0644%u0646%u0633%u062e %u0623%u0648 %u0627%u0644%u0637%u0628%u0627%u0639%u0629 %u064a%u0639%u0631%u0636 %u0641%u0627%u0639%u0644%u0647 %u0644%u0644%u0645%u0633%u0627%u0626%u0644%u0629 %u0627%u0644%u0642%u0627%u0646%u0648%u0646%u064a%u062924%u03c32 , s2 The basic properties of the standard deviation, %u03c3, as a measure of spread are as follows: %u03c3 measures spread about the mean and should be considered only when the mean is chosen as the measure of center. %u03c3 = 0 only when there is no spread, that is, when all observations have the same value. Otherwise, %u03c3 > 0. For examples of measures of dispersion visit : https://www.youtube.com/watch?v=E4HAYd0QnRcIV. Graphic Displays of Basic Statistical Descriptions These include quantile plots, quantile%u2013quantile plots, histograms, and scatter plots. Such graphs are helpful for the visual inspection of data, which is useful for data preprocessing. 1- Quantile Plot: is a simple and effective way to have a first look at a univariate data distribution . it displays all of the data for the given attribute (allowing the user to assess both the overall behavior and unusual occurrences) then it plots quantile information. For example: For a data xi data sorted in increasing order, fi indicates that approximately 100 fi% of the data are below or equal to the value xi
