
Page 23 - Demo
P. 23
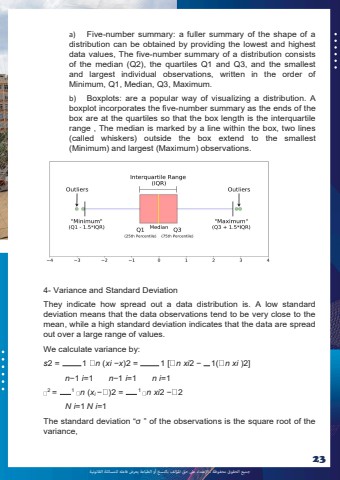
%u062c%u0645%u064a%u0639 %u0627%u0644%u062d%u0642%u0648%u0642 %u0645%u062d%u0641%u0648%u0638%u0629 %u0640 %u0627%u0625%u0644%u0639%u062a%u062f%u0627%u0621 %u0639%u0649%u0644 %u062d%u0642 %u0627%u0645%u0644%u0624%u0644%u0641 %u0628%u0627%u0644%u0646%u0633%u062e %u0623%u0648 %u0627%u0644%u0637%u0628%u0627%u0639%u0629 %u064a%u0639%u0631%u0636 %u0641%u0627%u0639%u0644%u0647 %u0644%u0644%u0645%u0633%u0627%u0626%u0644%u0629 %u0627%u0644%u0642%u0627%u0646%u0648%u0646%u064a%u062923a) Five-number summary: a fuller summary of the shape of a distribution can be obtained by providing the lowest and highest data values, The five-number summary of a distribution consists of the median (Q2), the quartiles Q1 and Q3, and the smallest and largest individual observations, written in the order of Minimum, Q1, Median, Q3, Maximum. b) Boxplots: are a popular way of visualizing a distribution. A boxplot incorporates the five-number summary as the ends of the box are at the quartiles so that the box length is the interquartile range , The median is marked by a line within the box, two lines (called whiskers) outside the box extend to the smallest (Minimum) and largest (Maximum) observations. 4- Variance and Standard Deviation They indicate how spread out a data distribution is. A low standard deviation means that the data observations tend to be very close to the mean, while a high standard deviation indicates that the data are spread out over a large range of values. We calculate variance by: s2 = 1 n (xi %u2212x)2 = 1 [ n xi2 %u2212 1( n xi )2]n%u22121 i=1 n%u22121 i=1 n i=12 = 1 n (xi %u2212 )2 = 1 n xi2 %u2212 2N i=1 N i=1The standard deviation %u201c%u03c3 %u201d of the observations is the square root of the variance,
