
Page 27 - Demo
P. 27
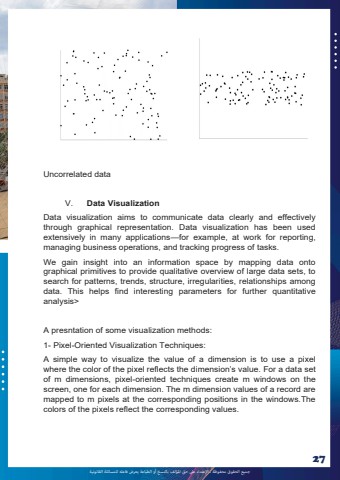
%u062c%u0645%u064a%u0639 %u0627%u0644%u062d%u0642%u0648%u0642 %u0645%u062d%u0641%u0648%u0638%u0629 %u0640 %u0627%u0625%u0644%u0639%u062a%u062f%u0627%u0621 %u0639%u0649%u0644 %u062d%u0642 %u0627%u0645%u0644%u0624%u0644%u0641 %u0628%u0627%u0644%u0646%u0633%u062e %u0623%u0648 %u0627%u0644%u0637%u0628%u0627%u0639%u0629 %u064a%u0639%u0631%u0636 %u0641%u0627%u0639%u0644%u0647 %u0644%u0644%u0645%u0633%u0627%u0626%u0644%u0629 %u0627%u0644%u0642%u0627%u0646%u0648%u0646%u064a%u062927Uncorrelated data V. Data VisualizationData visualization aims to communicate data clearly and effectively through graphical representation. Data visualization has been used extensively in many applications%u2014for example, at work for reporting, managing business operations, and tracking progress of tasks. We gain insight into an information space by mapping data onto graphical primitives to provide qualitative overview of large data sets, to search for patterns, trends, structure, irregularities, relationships among data. This helps find interesting parameters for further quantitative analysis> A presntation of some visualization methods: 1- Pixel-Oriented Visualization Techniques: A simple way to visualize the value of a dimension is to use a pixel where the color of the pixel reflects the dimension%u2019s value. For a data set of m dimensions, pixel-oriented techniques create m windows on the screen, one for each dimension. The m dimension values of a record are mapped to m pixels at the corresponding positions in the windows.The colors of the pixels reflect the corresponding values.
