
Page 28 - Demo
P. 28
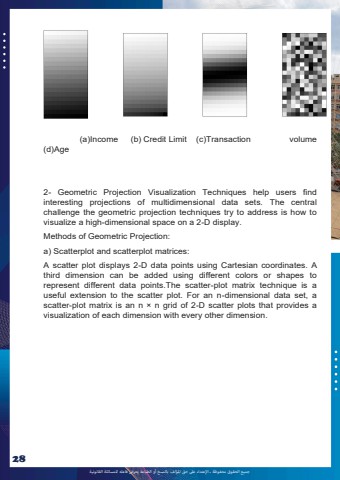
%u062c%u0645%u064a%u0639 %u0627%u0644%u062d%u0642%u0648%u0642 %u0645%u062d%u0641%u0648%u0638%u0629 %u0640 %u0627%u0625%u0644%u0639%u062a%u062f%u0627%u0621 %u0639%u0649%u0644 %u062d%u0642 %u0627%u0645%u0644%u0624%u0644%u0641 %u0628%u0627%u0644%u0646%u0633%u062e %u0623%u0648 %u0627%u0644%u0637%u0628%u0627%u0639%u0629 %u064a%u0639%u0631%u0636 %u0641%u0627%u0639%u0644%u0647 %u0644%u0644%u0645%u0633%u0627%u0626%u0644%u0629 %u0627%u0644%u0642%u0627%u0646%u0648%u0646%u064a%u062928 (a)Income (b) Credit Limit (c)Transaction volume (d)Age 2- Geometric Projection Visualization Techniques help users find interesting projections of multidimensional data sets. The central challenge the geometric projection techniques try to address is how to visualize a high-dimensional space on a 2-D display. Methods of Geometric Projection: a) Scatterplot and scatterplot matrices: A scatter plot displays 2-D data points using Cartesian coordinates. A third dimension can be added using different colors or shapes to represent different data points.The scatter-plot matrix technique is a useful extension to the scatter plot. For an n-dimensional data set, a scatter-plot matrix is an n %u00d7 n grid of 2-D scatter plots that provides a visualization of each dimension with every other dimension.
