
Page 30 - Demo
P. 30
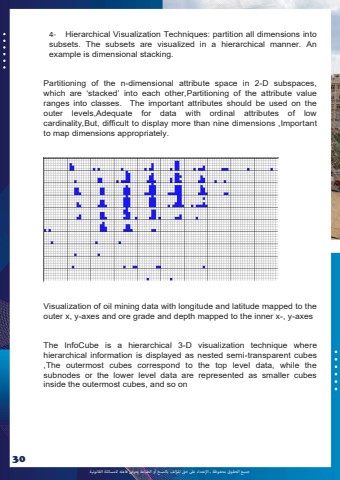
%u062c%u0645%u064a%u0639 %u0627%u0644%u062d%u0642%u0648%u0642 %u0645%u062d%u0641%u0648%u0638%u0629 %u0640 %u0627%u0625%u0644%u0639%u062a%u062f%u0627%u0621 %u0639%u0649%u0644 %u062d%u0642 %u0627%u0645%u0644%u0624%u0644%u0641 %u0628%u0627%u0644%u0646%u0633%u062e %u0623%u0648 %u0627%u0644%u0637%u0628%u0627%u0639%u0629 %u064a%u0639%u0631%u0636 %u0641%u0627%u0639%u0644%u0647 %u0644%u0644%u0645%u0633%u0627%u0626%u0644%u0629 %u0627%u0644%u0642%u0627%u0646%u0648%u0646%u064a%u0629304- Hierarchical Visualization Techniques: partition all dimensions into subsets. The subsets are visualized in a hierarchical manner. An example is dimensional stacking. Partitioning of the n-dimensional attribute space in 2-D subspaces, which are %u2018stacked%u2019 into each other,Partitioning of the attribute value ranges into classes. The important attributes should be used on the outer levels,Adequate for data with ordinal attributes of low cardinality,But, difficult to display more than nine dimensions ,Important to map dimensions appropriately. Visualization of oil mining data with longitude and latitude mapped to the outer x, y-axes and ore grade and depth mapped to the inner x-, y-axes The InfoCube is a hierarchical 3-D visualization technique where hierarchical information is displayed as nested semi-transparent cubes ,The outermost cubes correspond to the top level data, while the subnodes or the lower level data are represented as smaller cubes inside the outermost cubes, and so on
