
Page 29 - Demo
P. 29
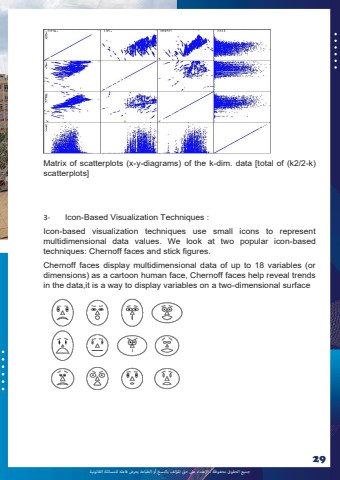
%u062c%u0645%u064a%u0639 %u0627%u0644%u062d%u0642%u0648%u0642 %u0645%u062d%u0641%u0648%u0638%u0629 %u0640 %u0627%u0625%u0644%u0639%u062a%u062f%u0627%u0621 %u0639%u0649%u0644 %u062d%u0642 %u0627%u0645%u0644%u0624%u0644%u0641 %u0628%u0627%u0644%u0646%u0633%u062e %u0623%u0648 %u0627%u0644%u0637%u0628%u0627%u0639%u0629 %u064a%u0639%u0631%u0636 %u0641%u0627%u0639%u0644%u0647 %u0644%u0644%u0645%u0633%u0627%u0626%u0644%u0629 %u0627%u0644%u0642%u0627%u0646%u0648%u0646%u064a%u062929 Matrix of scatterplots (x-y-diagrams) of the k-dim. data [total of (k2/2-k) scatterplots] 3- Icon-Based Visualization Techniques : Icon-based visualization techniques use small icons to represent multidimensional data values. We look at two popular icon-based techniques: Chernoff faces and stick figures. Chernoff faces display multidimensional data of up to 18 variables (or dimensions) as a cartoon human face, Chernoff faces help reveal trends in the data,it is a way to display variables on a two-dimensional surface
